Data model management
The Data Reference is the core data model of Lifetime Analytics. It is the catalog of Data. All the Subscription data and computed data used by the application are defined in the Main menu > Data Management > Data Reference.
With Data Reference and the required permission, you can change name, description, type, default value, usage as churn factors, etc accordingly to the subscription you provide to Lifetime Analytics. Be sure to be comfortable with data management and Lifetime Analytics before changing the Data Reference.
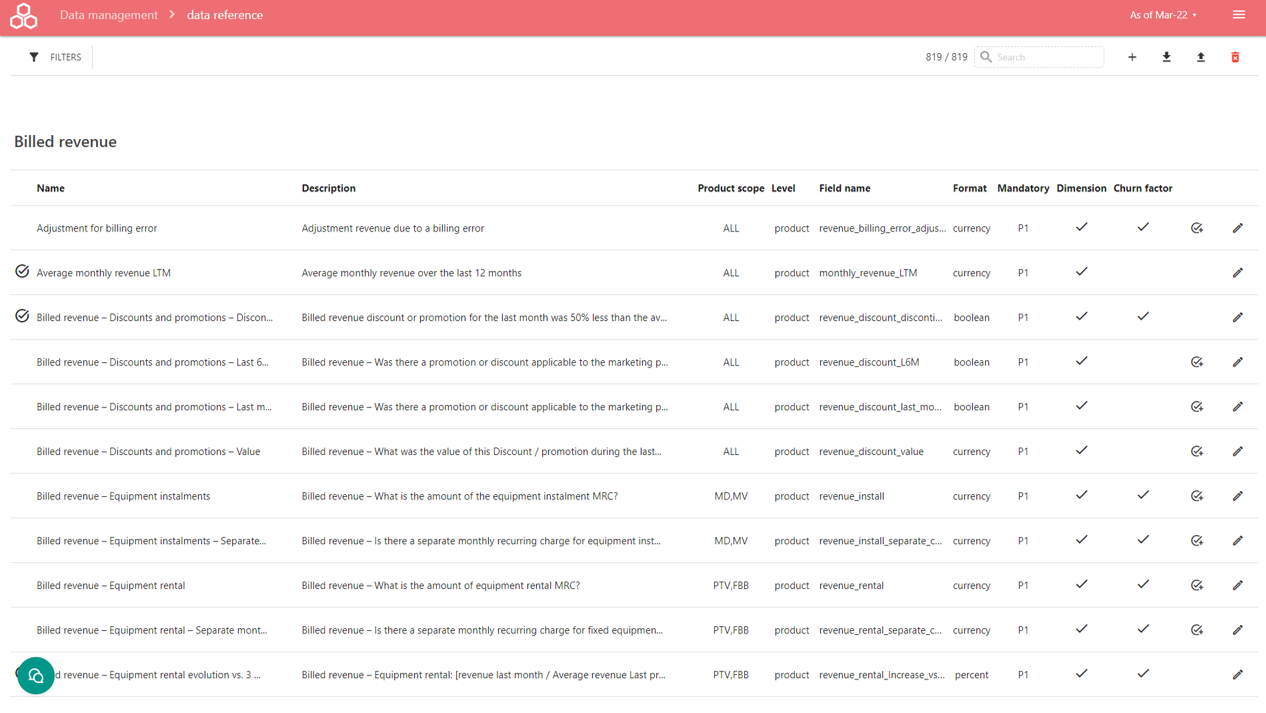
The data reference screen display per category the list of all data, by Category name. Each data has :
Name : Short name of the data
Category : Functional category of the data (eg. Billed Revenue) - organizing the Data Reference by Domain. Please use coherent name to ease users to navigate into the data model
Description : Long description of the expected or computed data – displayed while highlighting the Name of the data in the application.Please use coherent name to ease users to understand the data model
Product scope : RGU scope or ALL (See Admin Reference)
Level : Level of application of the data - Customer, Subscription or technical product data
Field name: identifying the field name provided into your Subscription data files
Format : expected and interpreted format of the data (eg Number, currency, date, percentage ...)
Mandatory : Level of priority for data import. Data with mandatory at Yes is required.
Default value : It is eventually the value to use when the data is missing for some subscription (eg zero for Exception revenue). Please consider use consistent default value. It can affect the cluster discovery or the interpretation of the charts.
Links : Select some link between data to ease the navigation across the data model. Eg link the revenue OOB with revenue OOB splits mobile roaming EU, etc.
Is Favorite : set the data as favorite in the top of data selection panel (See Deep diving into cluster details) to ease the use of important data such as Marketing Product name, Subscriber postal code, ...
Is Dimension : Is it available as data in Cluster or Action subscriber data dashboard (See Deep Diving into Cluster or Design Action Plan) ?
Is (Churn) Factor : Is it used for the Cluster discovery? Note : it can weirdly affect the cluster discovery if you set as churn factor some explicit churn factor like "Has required the portability", it will be raised as a churn factor by the application. Please be sure to understand how to define factors before using.
Define allowance/usage costs? : Does the data support some RGU dynamic costs (see Design Action Plan or Admin Reference). This setting is important for the Proposition design tool.
Define access costs ? : Does the data support some RGU static costs (see Design Action Plan or Admin Reference). This setting is important for the Proposition design tool.
The mark "circled done" means the data is computed by Lifetime Analytics. You do not have to provide these data.
The "circled done plus" allows to create by your self a computed data from the selected data, while selecting computation pattern or defining a formula. (See How to add computed subscription data?)

You can refine the list while pressing the "Filters" button and using the different filters :
Category : filter by Category name
Product scope : filter by RGU
Level : filter by level of application of the data - Customer, Subscription or technical product data
Mandatory : filter by P1, P2, P3, ...
Format
Computed : filter if computed or provided subscription data
You can refine the list of Data by name, category or description while using the Search box.
Press the "add" button to define a new Data into the data reference (See below)
Press the "export" or "import" button to export or import the Data Reference list into an Excel file or from an Excel file.
Note : The "import" requires strictly the same Excel format as the export. Please use the exported Excel as a template for your modification.
The import button performs creation and modification of the Data Reference, but no deletion. To delete a Data Reference, please use the "delete" button into the Data Reference Edit UI (See below).
The "remove all" button removes after confirmation the whole Data Reference list. Please use cautiously.
Creation/Edition of Data Reference
While clicking on the "edit" button, it opens a edition panel allowing to create/modify the data reference.
Pressing the "Delete" button deletes the data reference, after confirmation. The data removes the data from any UI and analysis.
Pressing the "Save" button saves the modification or the creation.
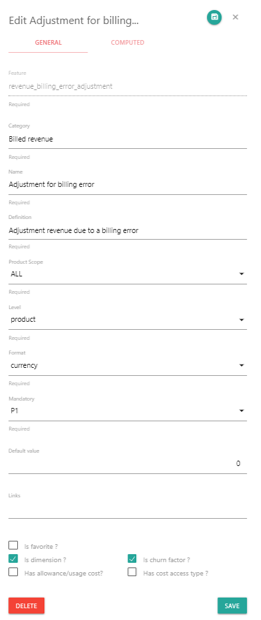
Creation of Computed Data Reference
The Computed Data References are data computed by the application using some predefined templates and formula to allow to create your own computation.
To enter into Computation definition mode, please switch the Computed? toggle button.
You can select the level on which you want to apply your computation :
Technical product : it performs the computation the technical product level
Subscription : it performs the computation the marketing product level, aggregating by Subscription id the input data
Customer : it performs the computation the customer level, aggregating by Customer id the input data
The type of computation defines the template to apply on the input data :
Native : internal computation template. Please do not use or change.
Formula : enter a calculation formula (see How to compute data using formula)
Has changed : Yes if the last month value is different (not equal) from the previous month value
Surge 3M : Last month value divided by the average on the last 3 months value. If there is no last 3 months value, then the surge is 1.0
Surge 12M : Last month value divided by the average on the last 12 months value. If there is no last 3 months value, then the surge is 1.0
Evolution : Average on the last 3 months divided by the average from 4 to 6 months. If there is no value for 4-6 months, the evolution is 1.
Change ratio : Last month value divided by the previous month value. If there is no previous month value, then the change ratio is 1.0
Gap : Difference between the last month value and the average on the last 3 months. If there is no last 3 months value, the gap is 0.
Termination : Return True if the input terminate this current month (ie was True in M-1 and False in M)
Vintage : Year of the date
Tenure : Number of months between the start date and the snapshot date.
Monthly Average per day : Total divided by the number of the days of the month
Note some types of computation are only available for particular data format : eg tenure requires an input data reference with a date format
The Input data reference dropdown defines the input data to use with the computation.
How to compute data using formula ?
The formula is parsed and executed with the pd.eval function from the Pandas module (See pandas documentation for more details).
NOTE: Only a limited number of modules are accessible inside the formula:
pd(Pandas) : see Pandas documentationnp(Numpy) : see Numpy documentationdatetime(datetime)
Some variables are available as :
snapshot_days:Number of days in the snapshotsnapshot_dt :Snapshot date (datetime format)
Examples:
Average number of hours per month
The formula below computes the daily average (in hours) of usage_PTV_Operator_SVOD_primary_screen feature (originally in second).
pd.to_numeric(data.usage_PTV_Operator_SVOD_primary_screen, errors='ignore') / 3600 / snapshot_daysWe use the function pd.to_numeric with the parameter errors='ignore' to cast the feature to a numeric format.
Number of days past or to the current date (snapshot date)
The formula below computes the delta (in days) between the end_commitment_at and the current snapshot date, to compute the remaining binding or unbinding of the subscribers.
pd.to_datetime(data.commitment_end_at).rsub(pd.to_datetime(snapshot_dt)).dt.daysWe use the function sub to compute the difference between the variable snapshot_dt for the curent snapshot date and the date of commitment_end_at.
The function pd.to_datetime to convert the data commitment_end_at as a pandas date.
The difference in days is given by pandas with .dt.days.
Mapping from ranges of values
The formula below maps a class following ranges of values of usage_PTV_sports. For usage_PTV_sports less than 100 (low), between 100-200 (medium) and greater than 201 (high)
pd.cut(data.usage_PTV_sports,[0,100,200,inf],labels=["Low","Medium","High"], right=False)The function pd.cut makes the mapping accordingly to:
edges list : -inf or inf are used for less than or greater than boundary
category list : it must match the list of edges
right=False : exclude the rightmost edge from each boundary
Apply translations onto Data Reference values
If you want to use into the application more comfortable values for postal code or fixed broadband access type than the values provided into the Subscription data files, you can apply some translations directly into Lifetime Analytics while using the Mappings tab.
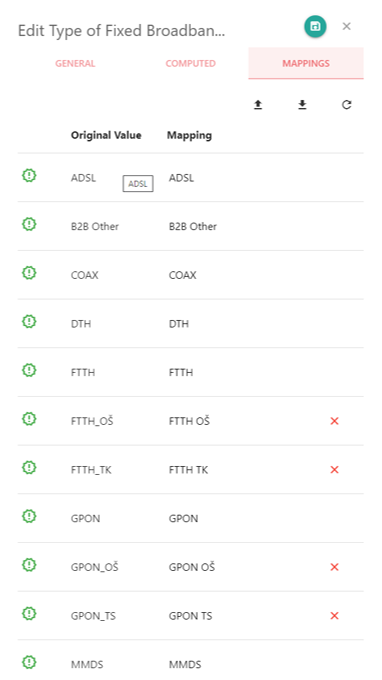
Press the "refresh" button to lookup the different values of the selected data from your imported Subscription data files. It lists as table the original value from your data files and allow edit a translated name as a mapping of values.
You can remove a translation while pressing the "clear" button.
The "export" and "import" buttons allow to export or import the list of mappings. Note : there is no deletion only modification of the mappings.
Press the "save" button to save your mappings. The users to re-log in to see the newly defined mappings applying into the application.