List the churn clusters
Description
This area is specifically designed to get an overview of ALL the automatically generated churn clusters at once.
A cluster regroups subscriptions from ONE AND ONLY ONE Marketing Product Family, subscriptions which share COMMON churn factors.
In other words, a cluster is an aggregation of subscriptions which i) belong to the same Marketing Product Family AND ii) are at risk of churn due to the same combination of churn factors.
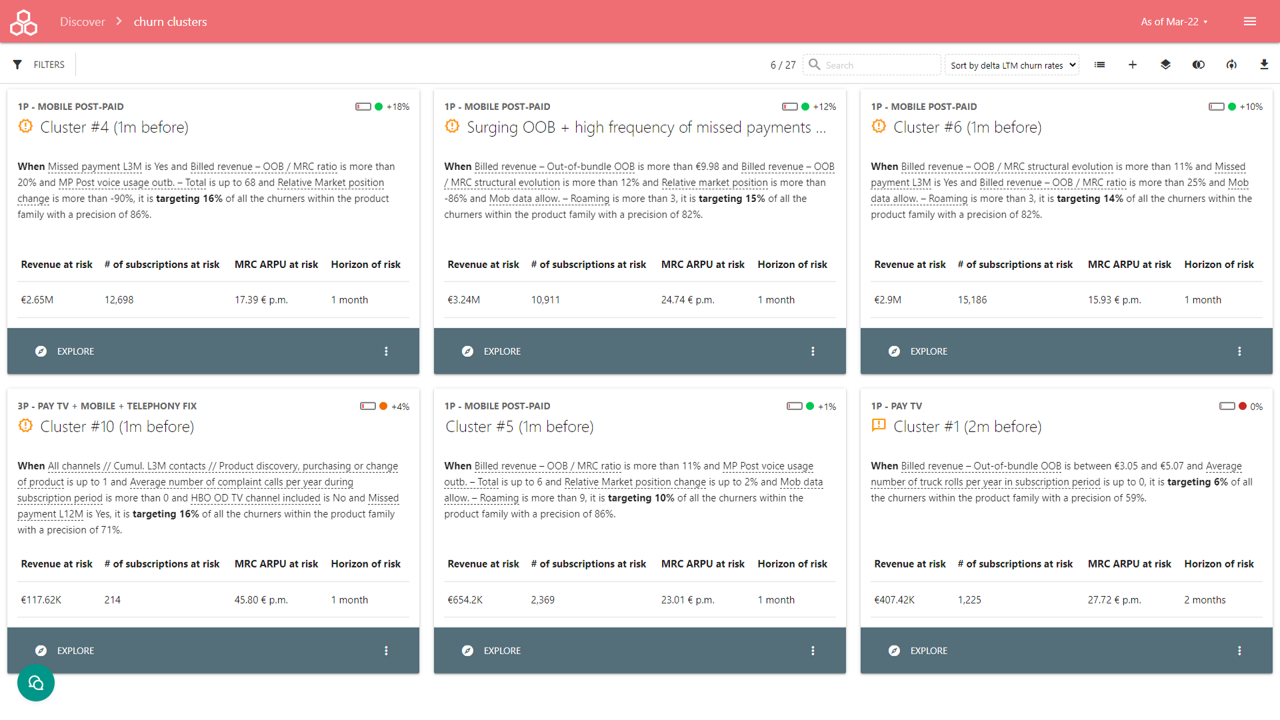
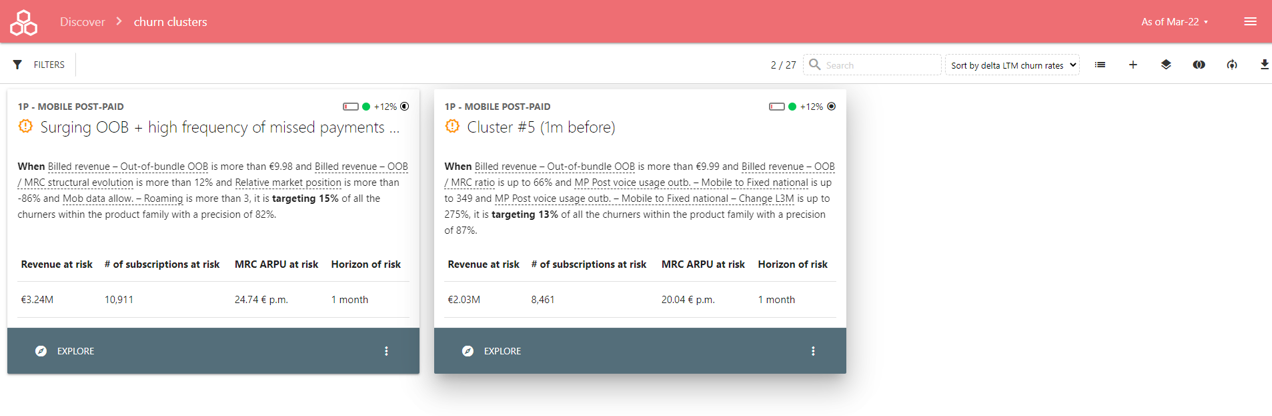
How to read A CLUSTER card ?
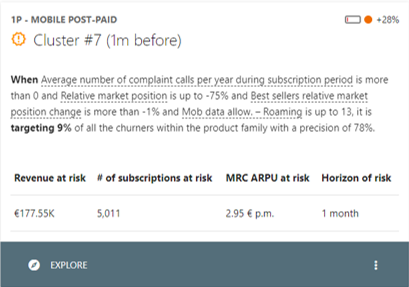
Each cluster is bind to an unique marketing product family, with a default cluster name you can edit while clicking onto the name.
The plain text description of the cluster provides a literal definition of the rule selecting the cluster's subscriptions. The terms of this definition are the main churn factors, not necessary the direct root cause of the churn. Please click on the Explore button to deep dive into the cluster.
At the top right side, the cluster displays 3 keys cluster quality metrics :
Recall (jauge) : percentage of the past monthly churners that cluster is able to capture. It defines how the cluster can catch all the churners.
Precision (circle - 3 colors : below 70% red=weak, between 70% and 90% orange=moderate, above 80% green=good) : percentage of the past monthly churners that cluster defines correctly as churners. It defines how the cluster can catch correctly churners.
Delta churn rate LTM - the most important metric : the difference of churn rates LTM of the cluster's subscriptions and the product family subscriptions. It defines the power of the cluster to catch LTM churners over the whole product family. +5% means +5% LTM churn rate points over the LTM churn rate of the product family. For illustration, if the LTM churn rate of the product family is 10%, it means the cluster identifies a set of subscriptions having a 15% LTM churn rate.
Each cluster displays :
Revenue at risk: sum of twelve months revenue MRC of the active subscriptions belonging to the cluster, free of commitment or having at least one missed payment L3M. It defines the estimation of how much revenue is at risk of churn.
Volume at risk: number of active subscriptions that belong to the churn cluster, free of commitment or having at least one missed payment L3M. It defines the estimation of how many subscription are at risk of churn.
ARPU at risk: [revenue at risk / volume at risk / 12]
Horizon: estimation of time horizon in month when the subscriptions have a high probability to churn.
Filtering/sorting the cluster list
While clicking onto the Filters button, you can select the filters to apply on the cluster list
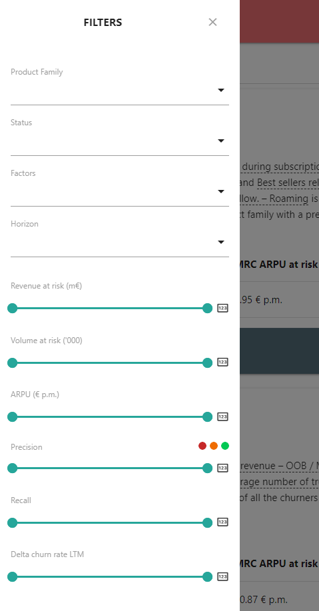
The available filters are :
Product family
Status : existing previously or newly discovered cluster
Churn factors used in the cluster definitions
Horizon of risk in months
Range of revenue at risk
Range of volume at risk
Range of ARPU at risk
Range of Precision : clicking on the colored circle, automatically set the range to the related 70%, 80% or 100% precision threshold
Range of Recall
Range of Delta LTM churn rate
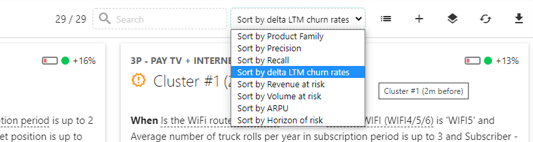
The top control panel allows display, sort or export the cluster list.
X / Y displays the number of selected clusters over the total number of clusters
The search box allows to filter using cluster's name or definition
The list of sorting arrangements allows to sort the cluster list accordingly
Switch between list view or card view the cluster
Add custom cluster (see detailed article about Custom Cluster)
Hide/unhide the "exotic" cluster, having poor quality metrics (low precision, low delta LTM churn rates). It requires a special permission.
Force refresh the computation of quality metrics for all the clusters. It requires a special permission.
Export the list of clusters as an Excel file
Comparing clusters sharing same subscriptions
Some clusters can share same subscriptions or overlap themselves. The default view lists only the main clusters, with best uplift (LTM churn rate delta or ARPU growth delta) hiding the clusters sharing more than 60% of the same subscriptions.
Pressing the "show with overlapping clusters" displays all the clusters with the overlapped clusters. Now, each cluster have a "circle" selector. When selecting a cluster, it displays the selected cluster (moving to the forefront) and the clusters sharing more than 60% of the subscriptions with the selected cluster subscriptions. Each overlapping clusters has a "filled circle" icon, indicating the overlapping rate with the selected cluster.
To return to the full list, press again the "circle" selector button of the selected cluster.